₹3,000 SIP for 12 Years in HDFC Mid Cap Fund: How It Grew to ₹12.6 Lakh (2014–2026)
- 21 November 2026 | 52 Views | By Mint2Save
Introduction: the ₹3,000 question
In November 2014, imagine a 24-year-old in their first job. After rent, groceries and the phone bill, about ₹3,000 is left at the end of each month. A colleague says, “Start an SIP.” A relative says, “Markets are gambling, keep it in the bank.” A friend says, “₹3,000 is too small to matter. Start when you earn more.”
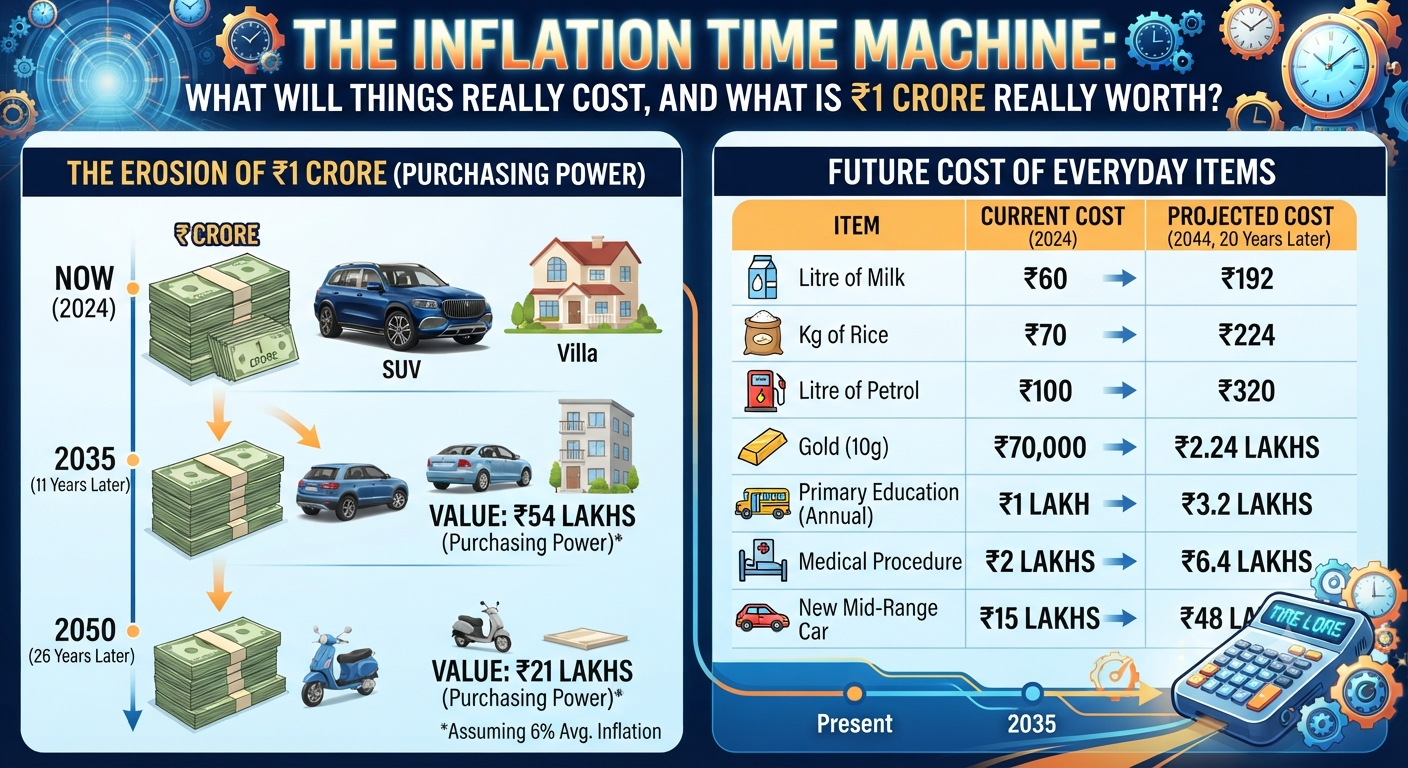
Our newbie starts an SIP anyway: ₹3,000 a month into HDFC Mid Cap Fund, auto-debited on the 5th. Then they do the hardest thing in investing: they keep going. They keep going through demonetisation, a two-year slump in mid-caps, a pandemic that wiped out more than a fifth of their savings in a few weeks, a war in Europe, inflation near 8%, a war in the Gulf and the longest losing streak in Indian markets in 25 years. Inflation Calculator India: What Will ₹1 Crore Really Be Worth? (Inflation Time Machine, 2026)
This article follows that investor, month by month, from November 2014 to October 2026, using the fund’s actual published NAVs. No projections, no assumed “12% returns” and no hindsight shortcuts. We will see:
- what 144 instalments of ₹3,000 grew to, and how that compares with a savings account, PPF, gold, the Nifty 50 and plain inflation
- how the value rose and fell through nine distinct phases of India’s economy and global events, and why
- what happened to investors who paused, panicked, started late or stepped up their SIP
- how much costs and taxes take, and what you actually keep
The timing matters. As this is written in November 2026, the Nifty is down sharply for the year, foreign investors have pulled out record amounts and many new investors are asking whether SIPs still work. Twelve years of real data is the best answer we have. It doesn’t say markets only go up. It says something more useful: an ordinary person, investing an ordinary amount, without any skill at timing the market, can build real wealth by staying invested.
If you are short of time, the next section gives you the result in one paragraph. If you want to understand why it happened, read on.
The bottom line
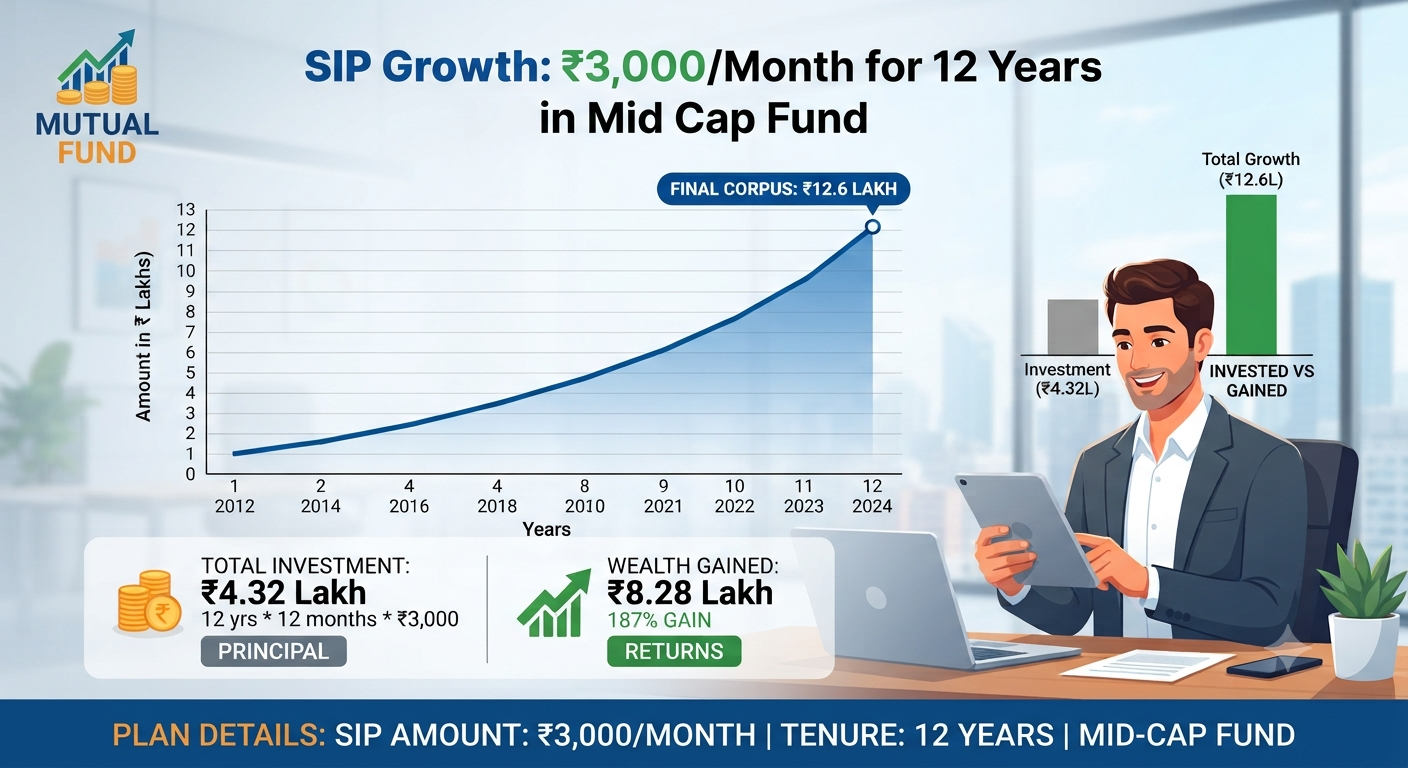
A first-time investor who put ₹3,000 every month into HDFC Mid Cap Fund (Regular Plan, Growth) from November 2014 to October 2026 invested ₹4,32,000 in 144 instalments. On 30 October 2026 those units were worth about ₹12.62 lakh: nearly 2.9 times the money put in, an annualised return (XIRR) of 16.7%.
That result came through demonetisation, an NBFC crisis, a pandemic crash, a war in Europe, the fastest rate-hike cycle in decades and, in 2026, a US–Iran war, ₹96 to the dollar and record foreign selling. At its worst, on 23 March 2020, the SIP was more than 20% below the money invested after five and a half years. The investors who kept going are the ones who got the ₹12.6 lakh.
The same ₹3,000 a month elsewhere (value on 30 October 2026):
- Savings account: about ₹5.15 lakh (2.9% a year), which did not even keep up with prices
- What it took just to keep pace with inflation: about ₹5.77 lakh (4.7% a year)
- PPF: about ₹6.82 lakh (7.3% a year, tax-free)
- Nifty 50 index fund: about ₹8.26 lakh (10.3% a year)
- HDFC Mid Cap Fund: about ₹12.62 lakh (16.7% a year)
One surprise: a gold ETF SIP ended slightly ahead, at about ₹13.18 lakh, almost entirely because gold more than doubled between late 2024 and early 2026. The rest of this article shows how each of these grew, phase by phase, and what the journey actually felt like.
Why an SIP works: three simple ideas
A Systematic Investment Plan (SIP) is an instruction to invest a fixed amount in a mutual fund on a fixed date every month. It sounds boring. That is the point.
1. Rupee-cost averaging: you buy more when prices are low. Your ₹3,000 buys more units when the NAV falls and fewer when it rises. In this example, the April 2020 instalment (NAV ₹38.88, during the Covid crash) bought 77 units. The September 2024 instalment (NAV ₹191.96, near the top) bought just 16 units. The same ₹3,000; five times the units. Over 12 years the investor’s average cost came to ₹66.63 per unit, while the simple average NAV on those 144 dates was ₹93.02.
2. Compounding: the money you made starts making money. For the first five years the SIP looked unimpressive. Then the earlier units, bought cheaply, multiplied. Of the final ₹12.62 lakh, only ₹4.32 lakh is your own money; ₹8.30 lakh is growth. About two-thirds of the entire gain arrived in the last four years.
3. Discipline: It takes the decision away from your emotions. Most people buy after markets have risen and stop after they have fallen. An auto-debit on the 5th of every month doesn’t read the news. It kept buying through demonetization, Covid, and a war, which is exactly when buying paid off most.
The formula behind the return figures in this article is XIRR, which treats every installment as a separate cash flow with its own date:
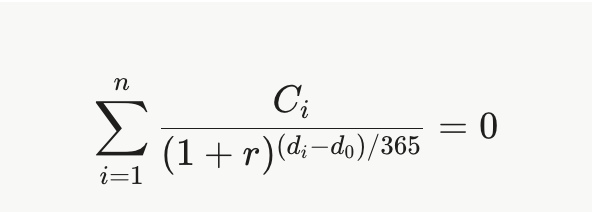
Here each C is a cash flow (minus ₹3,000 on each SIP date, plus the final value on the last date), d is its date, and r is the annual return that balances them.
The Experiment: Who, What, When
| Item | Assumption |
|---|---|
| Investor | A newbie who starts in November 2014 and never stops, pauses or changes the amount |
| Fund | HDFC Mid Cap Fund, Regular Plan, Growth option (called HDFC Mid-Cap Opportunities Fund until June 2025) |
| Amount | ₹3,000 a month, on the 5th (or the nearest working day) |
| Period | November 2014 to October 2026: 144 instalments, ₹4,32,000 in total |
| Valuation | NAV of ₹194.619 on 30 October 2026 |
| Data | Daily NAVs as published by AMFI (via mfapi.in); CPI inflation from MoSPI |
| Ignored | Stamp duty of 0.005% on purchases (about ₹22 over 12 years) and taxes until the tax section |
Why the Regular Plan? Most first-time investors buy through a bank, an app’s distributor route or an agent, and that is the Regular Plan, which pays a commission out of the fund’s expenses. The Direct Plan is cheaper, and the cost section shows how much that difference was worth.
Why a mid-cap fund? Mid-cap companies (ranked 101 to 250 by market value) are big enough to be established and small enough to grow fast. They also fall harder. That makes them a good test of whether an SIP’s discipline survives real volatility. HDFC Mid Cap Fund is India’s largest mid-cap scheme, managed by Chirag Setalvad since its launch in June 2007, and is benchmarked to the Nifty Midcap 150 TRI.
For the comparisons, each alternative gets exactly the same ₹3,000 on the same dates:
- Nifty 50: UTI Nifty 50 Index Fund (Regular Plan), a real, investable large-cap index fund
- Mid-cap index: Motilal Oswal Nifty Midcap 100 ETF, the longest-running mid-cap index product with daily data back to 2014
- Gold: Nippon India ETF Gold BeES
- Savings account: SBI’s actual savings rate at each date (4% falling to 2.5%), interest credited quarterly
- PPF: the government-notified PPF rate for each quarter (8.7% falling to 7.1%), credited every March
- Inflation: each ₹3,000 grown at the actual CPI inflation rate, month by month
The 12-year journey in one picture
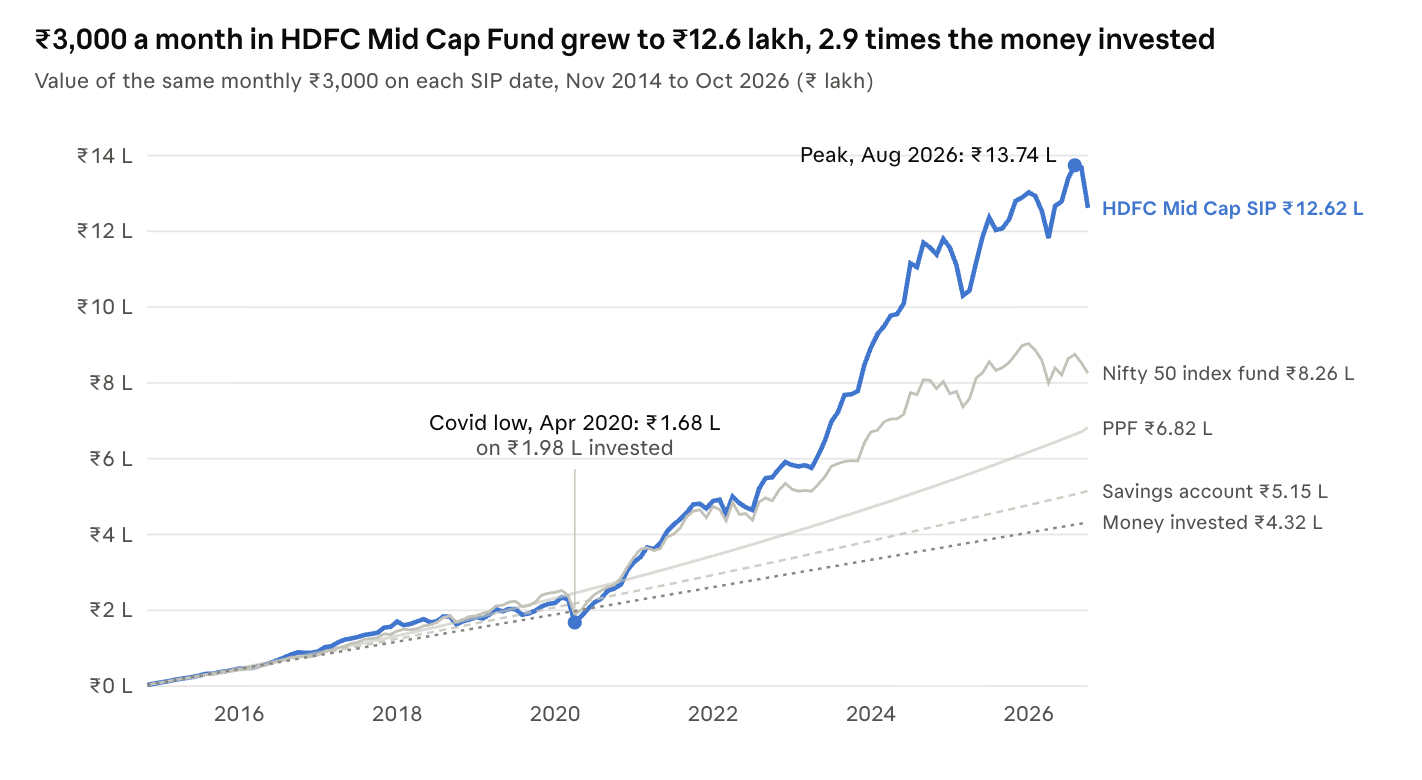
For the first five and a half years the mid-cap SIP was barely ahead of the money put in, and in April 2020 it fell well below it. Almost all of the gap between the blue line and the rest opened after 2020. The savings account and PPF lines are smooth because they never fall, but they also never take off.
Nine phases: what the world did, and what it did to the SIP
Twelve years were not one smooth ride. They were nine distinct phases, three of them painful. The table shows each phase’s NAV move and where the SIP stood at its end.
| Phase | Period | NAV move | Nifty 50 move | Invested by the end | SIP value at the end | XIRR so far |
|---|---|---|---|---|---|---|
| 1. Honeymoon, then a global scare | Nov 2014 – Feb 2016 | +4% | −10% | ₹48,000 | ₹45,064 | −8.6% |
| 2. Mid-cap mania | Mar 2016 – Jan 2018 | +63% | +45% | ₹1,17,000 | ₹1,57,587 | 18.6% |
| 3. The long winter | Feb 2018 – Mar 2020 | −31% | −16% | ₹1,95,000 | ₹1,64,961 | −6.1% |
| 4. The V-shaped comeback | Apr 2020 – Oct 2021 | +138% | +106% | ₹2,52,000 | ₹4,78,130 | 17.9% |
| 5. Inflation and rate hikes | Nov 2021 – Mar 2023 | +9% | −1% | ₹3,03,000 | ₹5,72,966 | 14.7% |
| 6. The golden run | Apr 2023 – Sep 2024 | +89% | +45% | ₹3,57,000 | ₹11,54,218 | 22.4% |
| 7. The correction | Oct 2024 – Mar 2025 | −11% | −8% | ₹3,75,000 | ₹10,40,672 | 18.5% |
| 8. Rate cuts and recovery | Apr 2025 – Jan 2026 | +21% | +13% | ₹4,05,000 | ₹12,90,421 | 19.3% |
| 9. War, oil and foreign selling | Feb 2026 – Oct 2026 | −4% | −10% | ₹4,32,000 | ₹12,61,881 | 16.7% |
NAV and Nifty 50 moves are measured between SIP dates (the Nifty 50 through the UTI Nifty 50 Index Fund). “At the end” is the first SIP date of the next phase; for phase 9 it is 30 October 2026.
Phase 1 (Nov 2014 – Feb 2016): the honeymoon, then a global scare
Our investor started six months after the 2014 general election, when hopes of reform were high. Then the world intervened. Crude oil collapsed from over $100 to under $30 a barrel, China devalued the yuan in August 2015, and global markets fell sharply in August 2015 and again in early 2016. The Nifty 50 lost about 10% over this stretch. The fund held up better (+4%), but because the investor had bought at higher prices along the way, the SIP was worth ₹45,064 on ₹48,000 invested by March 2016. Sixteen months of discipline and the newbie was in the red.
Phase 2 (Mar 2016 – Jan 2018): mid-cap mania
Falling interest rates, a weak dollar and a wave of domestic money turned mid-caps into the market’s darlings. Demonetisation in November 2016 caused only a brief dip: the NAV slipped from ₹46.88 to ₹43.16 and was back above ₹47 by February 2017. GST arrived in July 2017. Monthly SIP inflows into mutual funds kept setting records. The NAV rose 63%, and by February 2018 the SIP was worth ₹1.58 lakh on ₹1.17 lakh: an XIRR of 18.6%. This is when many newbies decide investing is easy.
Phase 3 (Feb 2018 – Mar 2020): the long winter
This was the real test, and it lasted two years. The February 2018 Budget brought back a 10% tax on long-term equity gains. SEBI’s new rules on how funds must be categorised forced mid-cap funds to stick to genuine mid-caps, and the sector was already expensive. In September 2018 IL&FS defaulted, freezing credit for NBFCs and the mid-sized companies that relied on them. Crude rose, the rupee crossed 74 to the dollar, the US–China trade war escalated and India’s GDP growth slowed through 2019. The corporate tax cut of September 2019 brought only brief relief.
Then Covid-19 arrived. The NAV fell from ₹56.04 in February 2020 to ₹36.45 on 23 March 2020. On that day, five and a half years of SIPs (₹1.95 lakh) were worth just ₹1.55 lakh: a loss of over 20%. The NAV was back to about where it had been in January 2015, when the SIP was three months old.
This is the moment most SIPs die. It is also the moment the SIP did its best work: the instalments of March to June 2020 bought units at the lowest prices of the entire 12 years.
Phase 4 (Apr 2020 – Oct 2021): the V-shaped comeback
The RBI cut the repo rate to 4%, governments and central banks around the world flooded markets with money, vaccines arrived, and millions of new retail investors opened demat accounts. Corporate profits recovered faster than anyone expected. The NAV went from ₹38.88 to ₹92.48, up 138% in 19 months. By November 2021 the SIP was worth ₹4.78 lakh on ₹2.52 lakh. The units bought in the panic of 2020 had more than doubled.
Phase 5 (Nov 2021 – Mar 2023): inflation and rate hikes
Russia invaded Ukraine in February 2022. Oil spiked above $100, India’s CPI inflation rose to 7.8% in April 2022, and the RBI raised the repo rate by 2.5 percentage points between May 2022 and February 2023, to 6.5%. The US Federal Reserve raised rates at its fastest pace in four decades, and foreign investors pulled money out of India. Markets went sideways: the Nifty 50 ended this phase slightly down and the Nifty Midcap 100 ETF fell 3%. HDFC Mid Cap Fund still gained about 9%, thanks to the fund manager’s stock selection in a market where the index went nowhere. The SIP stood at ₹5.73 lakh on ₹3.03 lakh.
Phase 6 (Apr 2023 – Sep 2024): the golden run
India became the fastest-growing large economy. Government capital spending, a manufacturing push, booming domestic SIP flows and a re-rating of PSU and capital-goods stocks lifted mid-caps to record highs. The general election result of 4 June 2024 caused a one-day crash, which was recovered within weeks. The NAV almost doubled (+89%) in 18 months. By October 2024 the SIP was worth ₹11.54 lakh on ₹3.57 lakh, an XIRR of 22.4%. In this phase alone the portfolio gained about ₹5.3 lakh on top of the new instalments, more than the investor had put in over ten years.
Phase 7 (Oct 2024 – Mar 2025): the correction
Valuations had run ahead of earnings. Foreign investors sold Indian shares at a record pace in October 2024, Chinese stimulus pulled money towards China, company results disappointed and the threat of US tariffs hung over global markets. The NAV fell 11% from its September 2024 level; the mid-cap index fell 13%. The SIP gave back over ₹1 lakh of paper gains, to ₹10.41 lakh.
Phase 8 (Apr 2025 – Jan 2026): rate cuts and recovery
The year opened with the shock of US “reciprocal” tariffs on 2 April 2025, but India’s own conditions improved quickly. Inflation fell steadily, to a series low of 0.25% in October 2025. The RBI cut the repo rate by a full percentage point in 2025, to 5.5%, and cut the cash reserve ratio, then cut once more in December to 5.25%. GST rates were rationalised in September 2025, supporting consumption. The NAV rose 21%, and in early 2026 the SIP touched ₹12.90 lakh on ₹4.05 lakh.
Phase 9 (Feb 2026 – Oct 2026): war, oil and foreign selling
2026 has been a hard year. War between the US and Iran broke out in early March, threatening oil shipments through the Strait of Hormuz. Brent crude futures traded above $110 a barrel in late March, the rupee weakened past 95 to the dollar, and mid- and small-caps were sold hardest. A ceasefire on 8 April triggered the Sensex’s biggest one-day gain in five years, and a peace deal in June ended a conflict of 107 days. The SIP recovered to its all-time high of about ₹13.74 lakh in August 2026.
Then came a second wave of selling. Foreign investors pulled out about ₹3.04 lakh crore from Indian shares in 2026 up to early October, more than in the whole of 2025. Rising US bond yields, expensive oil and a weak rupee drove the Nifty and Sensex to eight straight weekly losses, their longest losing run in 25 years. Inflation climbed back to 6.09% in October, above the RBI’s tolerance band, and the RBI raised the repo rate to 5.5% on 7 October. Between August and the end of October the SIP lost over ₹1.1 lakh of value, ending at ₹12.62 lakh.
Notice what happened, though: in a year when the Nifty 50 fell about 10% between SIP dates, the mid-cap fund fell only 4%, and the 2026 instalments were buying units at lower prices. The long-term return is still 16.7% a year.
Year by year: how the returns fluctuated
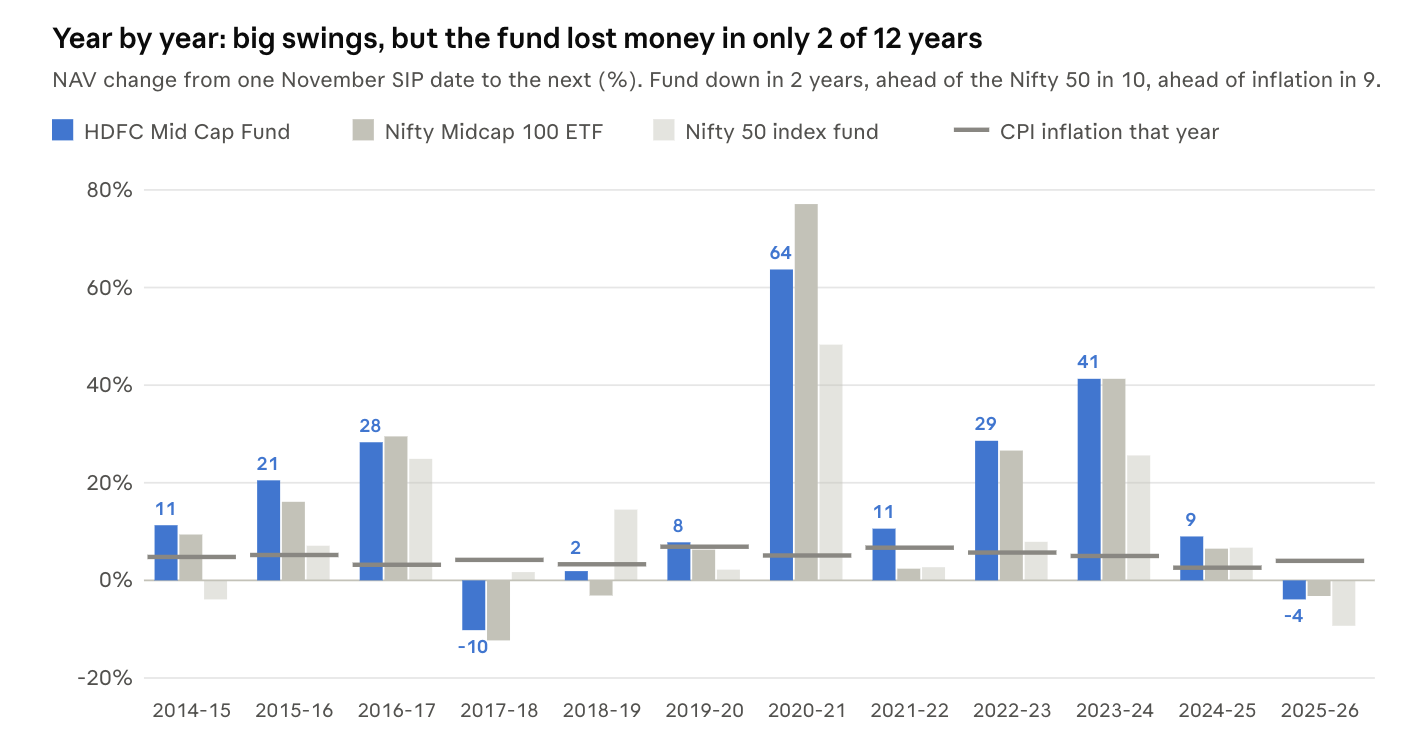
The best year (November 2020 to November 2021) delivered +64%; the worst (2017-18) lost 10%. That is a swing of 74 percentage points for the same fund. In 2018-19 the Nifty 50 rose 14.5% while the mid-cap fund managed under 2%, a reminder that mid-caps can lag for long stretches. An SIP doesn’t need you to guess which year is which: it simply buys every month, and the good years more than paid for the bad ones.
The scoreboard: the same ₹3,000 a month, eight ways
Every option below received ₹3,000 on the same 144 dates, ₹4,32,000 in total. Values are on 30 October 2026, before tax unless stated.
| Where the money went | Value | Gain | Annual return (XIRR) | Tax on the gain | Can you take it out? |
|---|---|---|---|---|---|
| HDFC Mid Cap Fund, Direct Plan | ₹13,34,401 | ₹9,02,401 | 17.6% | 12.5% LTCG above ₹1.25 lakh a year | Any time (1% exit load within a year) |
| Gold ETF (Gold BeES) | ₹13,18,219 | ₹8,86,219 | 17.4% | 12.5% LTCG after 12 months, no exemption | Any trading day |
| HDFC Mid Cap Fund, Regular Plan | ₹12,61,881 | ₹8,29,881 | 16.7% | 12.5% LTCG above ₹1.25 lakh a year | Any time (1% exit load within a year) |
| Nifty Midcap 100 ETF | ₹11,60,573 | ₹7,28,573 | 15.5% | Same as equity funds | Any trading day |
| Nifty 50 index fund | ₹8,25,653 | ₹3,93,653 | 10.3% | Same as equity funds | Any time |
| PPF | ₹6,81,729 | ₹2,49,729 | 7.3% | Tax-free | Locked until the account matures in 2030 (partial withdrawals allowed) |
| Just keeping up with inflation | ₹5,76,991 | ₹1,44,991 | 4.7% | ||
| SBI savings account | ₹5,15,115 | ₹83,115 | 2.9% | Taxed at your slab (₹10,000 a year deductible under 80TTA) | Any time |
What the scoreboard says:
- Equity beat every fixed-return option by a wide margin. The regular-plan SIP ended with ₹4.36 lakh more than the Nifty 50 index fund, ₹5.80 lakh more than PPF and ₹7.47 lakh more than a savings account.
- The savings account lost money in real terms. It grew to ₹5.15 lakh, but keeping pace with prices needed ₹5.77 lakh. Twelve years of “safe” saving cost about ₹62,000 of purchasing power.
- PPF did its job, and no more. It beat inflation by about 2.6 percentage points a year, tax-free, with zero volatility. That is useful for the safe part of a portfolio, but it cannot build wealth like equity.
- The fund roughly matched its benchmark, and beat the mid-cap ETF. HDFC’s own factsheet shows a 10-year SIP (to 29 May 2026) returned 18.92% in the fund against 19.16% for the Nifty Midcap 150 TRI and 11.62% for the Nifty 50 TRI. Most of the extra return came from owning mid-caps and staying invested, not from picking a magic fund.
- Gold’s finish was a sprint, not a marathon. For its first ten years the gold SIP trailed far behind: in October 2024 it was worth about ₹6.8 lakh against ₹11.6 lakh in the mid-cap fund. Then gold more than doubled in rupee terms between late 2024 and early 2026, on central-bank buying, war and a falling rupee. Gold is an excellent diversifier; it is a poor engine on its own, because it pays no dividends and earns nothing, and long flat stretches are normal.
Against inflation: what the money can actually buy
Returns only matter after inflation. Between November 2014 and October 2026, consumer prices in India rose by about 73%, an average of 4.7% a year. A basket that cost ₹100 when the SIP started costs about ₹173 today. The ₹3,000 the investor set aside in November 2014 needs about ₹5,200 to buy the same things now.
The real (after-inflation) return is roughly the nominal return minus inflation:
\text{Real return} = \frac{1 + \text{nominal return}}{1 + \text{inflation}} - 1| Option | Nominal return a year | Real return a year (after 4.7% inflation) | What it did to purchasing power |
|---|---|---|---|
| HDFC Mid Cap Fund (Regular) | 16.7% | about 11.5% | Grew it to more than double |
| Nifty 50 index fund | 10.3% | about 5.3% | Grew it steadily |
| PPF | 7.3% | about 2.5% | Protected it, with a little extra |
| Savings account | 2.9% | about −1.7% | Shrank it every year |
In plain terms, the ₹12.62 lakh in the mid-cap SIP is worth about 2.2 times the inflation-matched amount of ₹5.77 lakh. The savings account is worth only 89% of it.
Inflation is not a thing of the past. CPI inflation was 0.25% in October 2025, but in October 2026 it is back to 6.09%, driven by food prices up nearly 9%. With SBI paying 2.5% on savings balances, money parked in a savings account is now losing roughly 3.5% of its buying power every year.
Your behaviour matters more than the fund
The same fund, the same ₹3,000, the same 12 years. Five investors, five very different outcomes:
| Investor | What they did | Money invested | Value on 30 Oct 2026 |
|---|---|---|---|
| The steady one | Never stopped, never changed | ₹4,32,000 | ₹12,61,881 |
| The step-up one | Raised the SIP by 10% every November (₹3,000 rising to about ₹8,560) | ₹7,69,834 | ₹19,00,299 |
| The pauser | Stopped for the Covid year (Apr 2020 – Mar 2021), then restarted | ₹3,96,000 | ₹11,30,915 |
| The late starter | Waited five years and began in November 2019 | ₹2,52,000 | ₹4,90,666 |
| The panic seller | Stopped and redeemed everything in April 2020 | ₹1,95,000 | ₹1,64,961 (cashed out in 2020) |
The panic seller turned a temporary paper loss into a permanent loss of about ₹30,000, and missed everything that followed. The units they sold in April 2020 would be worth about ₹8.3 lakh today.
The pauser saved ₹36,000 by skipping 12 instalments in the scariest year. Those 12 instalments would have grown to about ₹1.31 lakh: 3.6 times their cost. Skipping SIPs when markets are falling means skipping the cheapest units you will ever buy.
The late starter lost the most to a single decision. The first five years of instalments (₹1.80 lakh) grew to about ₹7.7 lakh, more than half of the final value, even though those early years looked dull at the time. Starting late is the one mistake an SIP can’t fix.
The step-up investor shows the simplest upgrade. A 10% yearly increase is roughly in line with salary growth for many earners, and it lifted the final value by over ₹6.3 lakh compared with the steady investor. It also keeps the SIP’s real value from being eaten by inflation: ₹3,000 in 2014 is worth about ₹5,200 today.
What about investing a lump sum instead? Putting the whole ₹4,32,000 in on day one, in November 2014, would have grown to about ₹25 lakh. But a newbie rarely has 12 years of savings on day one. An SIP is how a salary becomes an investment; it is not a trick to beat lump sums.
Costs and taxes: what you actually keep
Regular vs Direct: a ₹72,500 difference
Every mutual fund has two plans with the same portfolio. The Regular Plan pays a commission to the distributor; the Direct Plan doesn’t, so its expense ratio is lower. In October 2026, HDFC Mid Cap Fund’s Regular Plan charged about 1.31% a year, against roughly 0.74% for the Direct Plan.
That gap of about 0.6 to 0.8 percentage points a year looks tiny. Over 12 years of SIPs it was worth ₹72,520: the Direct Plan SIP grew to ₹13,34,401 against ₹12,61,881. If you are comfortable choosing funds yourself, you can buy Direct plans on the fund house’s website, MF Central or most investing apps that offer a Direct option. If you value advice, a fee-only SEBI-registered investment adviser plus Direct plans is often cheaper than commission-based Regular plans.
Tax on the gains
Equity mutual fund gains are taxed only when you sell:
- Held over 12 months (long-term): 12.5% on gains above ₹1.25 lakh in a financial year, plus 4% cess. (Before 23 July 2024 it was 10% above ₹1 lakh.)
- Held 12 months or less (short-term): 20%, plus cess.
- Exit load: HDFC Mid Cap Fund charges 1% on units redeemed within a year of purchase.
Each SIP instalment is a separate purchase, so its 12-month clock starts on its own date. If our investor redeemed everything on 30 October 2026:
| Item | Amount |
|---|---|
| Value of all units | ₹12,61,881 |
| Long-term gain (instalments up to Oct 2025) | ₹8,31,143 |
| Tax at 12.5% + cess on gain above ₹1.25 lakh | about ₹91,800 |
| Short-term units (Nov 2025 – Oct 2026) | a small loss of about ₹1,300, so no tax |
| Exit load on those recent units | about ₹350 |
| Left in hand | about ₹11.70 lakh (XIRR 15.6% after tax) |
Two simple ways to keep more:
- Don’t redeem everything at once. Withdraw only what you need, and only units older than a year. The ₹1.25 lakh exemption applies every financial year.
- Harvest gains each year. Selling units with up to ₹1.25 lakh of long-term gain each financial year and reinvesting the money resets your purchase price and pays no tax. (The exit load applies to the new units only if you sell them within a year.)
For comparison, PPF is fully tax-free, while savings-account interest is taxed at your slab rate beyond the ₹10,000 deduction under Section 80TTA (old regime).
Honest caveats, and a checklist for new investors
What this example does not prove
- Past returns are not a promise. The 12 years covered here included a strong decade for Indian mid-caps. The next 12 could be weaker. A 16.7% return should not be your planning assumption; something closer to 10–12% for equity is more prudent.
- One fund is one example. HDFC Mid Cap Fund has been one of the better mid-cap funds. Other mid-cap funds returned more or less over the same period. The bigger lesson is about the asset class and the habit, not this particular scheme.
- Mid-caps are volatile. The SIP was below the money invested at times in 2016 and 2020, and the NAV fell about 40% from its January 2018 high to its March 2020 low. You need at least 7 years and a strong stomach for a mid-cap SIP. Many investors are better served with a large-cap or flexi-cap fund as the core and mid-caps as a smaller part.
- The ending date matters. This article ends in October 2026, two months after a peak and in the middle of a correction. Ending in August 2026 would have shown ₹13.74 lakh; ending in April 2020 would have shown a loss. The longer you stay, the less any single ending date matters.
A newbie’s SIP checklist
- Keep 6 months of expenses in an emergency fund (a savings account or liquid fund) before starting an equity SIP
- Pick an amount you can keep paying in a bad year, not just a good one
- Choose the fund category by time horizon: 7+ years for mid-caps, 5+ years for large-cap or flexi-cap funds
- Prefer the Direct Plan if you can choose funds yourself
- Set the SIP date a few days after your salary arrives
- Turn on an annual step-up of 5–10%
- Never stop the SIP because markets are falling; that is when it buys the most units
- Review once a year, not once a day, and compare with the fund’s benchmark, not with your friend’s portfolio
- Plan withdrawals around the ₹1.25 lakh yearly tax-free limit on long-term gains
Quick FAQ
Is ₹3,000 a month too little to matter? No. In this example it became ₹12.6 lakh. Most funds accept SIPs from ₹100 a month, so start with what you can, and step it up.
What is a good SIP return? Compare the XIRR with the fund’s benchmark and with inflation, over at least five to seven years. Beating inflation by 5–7 percentage points a year in equity is a good long-term outcome.
Should I stop my SIP when the market is falling, like in 2026? History in this very fund says no. The April 2020 instalment, bought in the worst panic, is worth five times its cost today. A falling market is when an SIP buys the most units.
Is it better to invest on a particular date of the month? Over long periods the date makes very little difference. Pick a date just after your salary arrives so the money is always there.
Should I choose a mid-cap fund as my first fund? Only if you can stay invested for seven years or more and won’t panic during a 30–40% fall. Many beginners start with a Nifty 50 index fund or a flexi-cap fund and add mid-caps later.
Why did gold do so well, and should I switch to gold? Gold surged in 2025 and 2026 on central-bank buying, wars and a weaker rupee. For most of the 12 years it lagged far behind. A 10–15% allocation to gold can steady a portfolio; switching everything to whatever did best last year is how investors buy high.
Calculations are by Mint2Save from the NAV data above, using XIRR on SIP dates (the 5th of each month, or the nearest working day). Savings and PPF values are modelled from the notified rates. Figures are rounded.
Disclaimer: This article is for education only and is not investment advice or a recommendation to buy any fund. Mutual fund investments are subject to market risks; read all scheme-related documents carefully. Past performance does not guarantee future returns. Consult a SEBI-registered investment adviser before investing.
Related Posts


Subscribe to get the best of finance and fintech. Regularly.
Categories
Popular

- 31 May 2016 | 18638 Views

- 16 June 2020 | 16038 Views

- 19 May 2021 | 15550 Views

- 14 May 2021 | 12314 Views
Recent