Understanding the Gini Index: Measuring Income Inequality
- 24 September 2023 | 3000 Views | By Mint2Save
Income inequality is a critical social and economic issue that affects societies worldwide. It’s a measure of how resources, particularly income, are distributed among a population. To quantify this inequality, various metrics are used, and one of the most widely employed measures is the Gini Index, also known as the Gini coefficient or Gini ratio. In this article, we will explore the Gini Index in depth, covering its definition, calculation, significance, historical context, criticisms, and real-world applications. The Economics of iPhone | iPhone Cultural Impacts
What is the Gini Index?
The Gini Index is a statistical measure of income or wealth inequality within a population. It provides a numerical representation of how evenly or unevenly income or wealth is distributed among the members of a society or a specific group. The index is expressed as a value between 0 and 1, where 0 represents perfect equality (everyone has the same income or wealth), and 1 signifies perfect inequality (one person or household has all the income or wealth).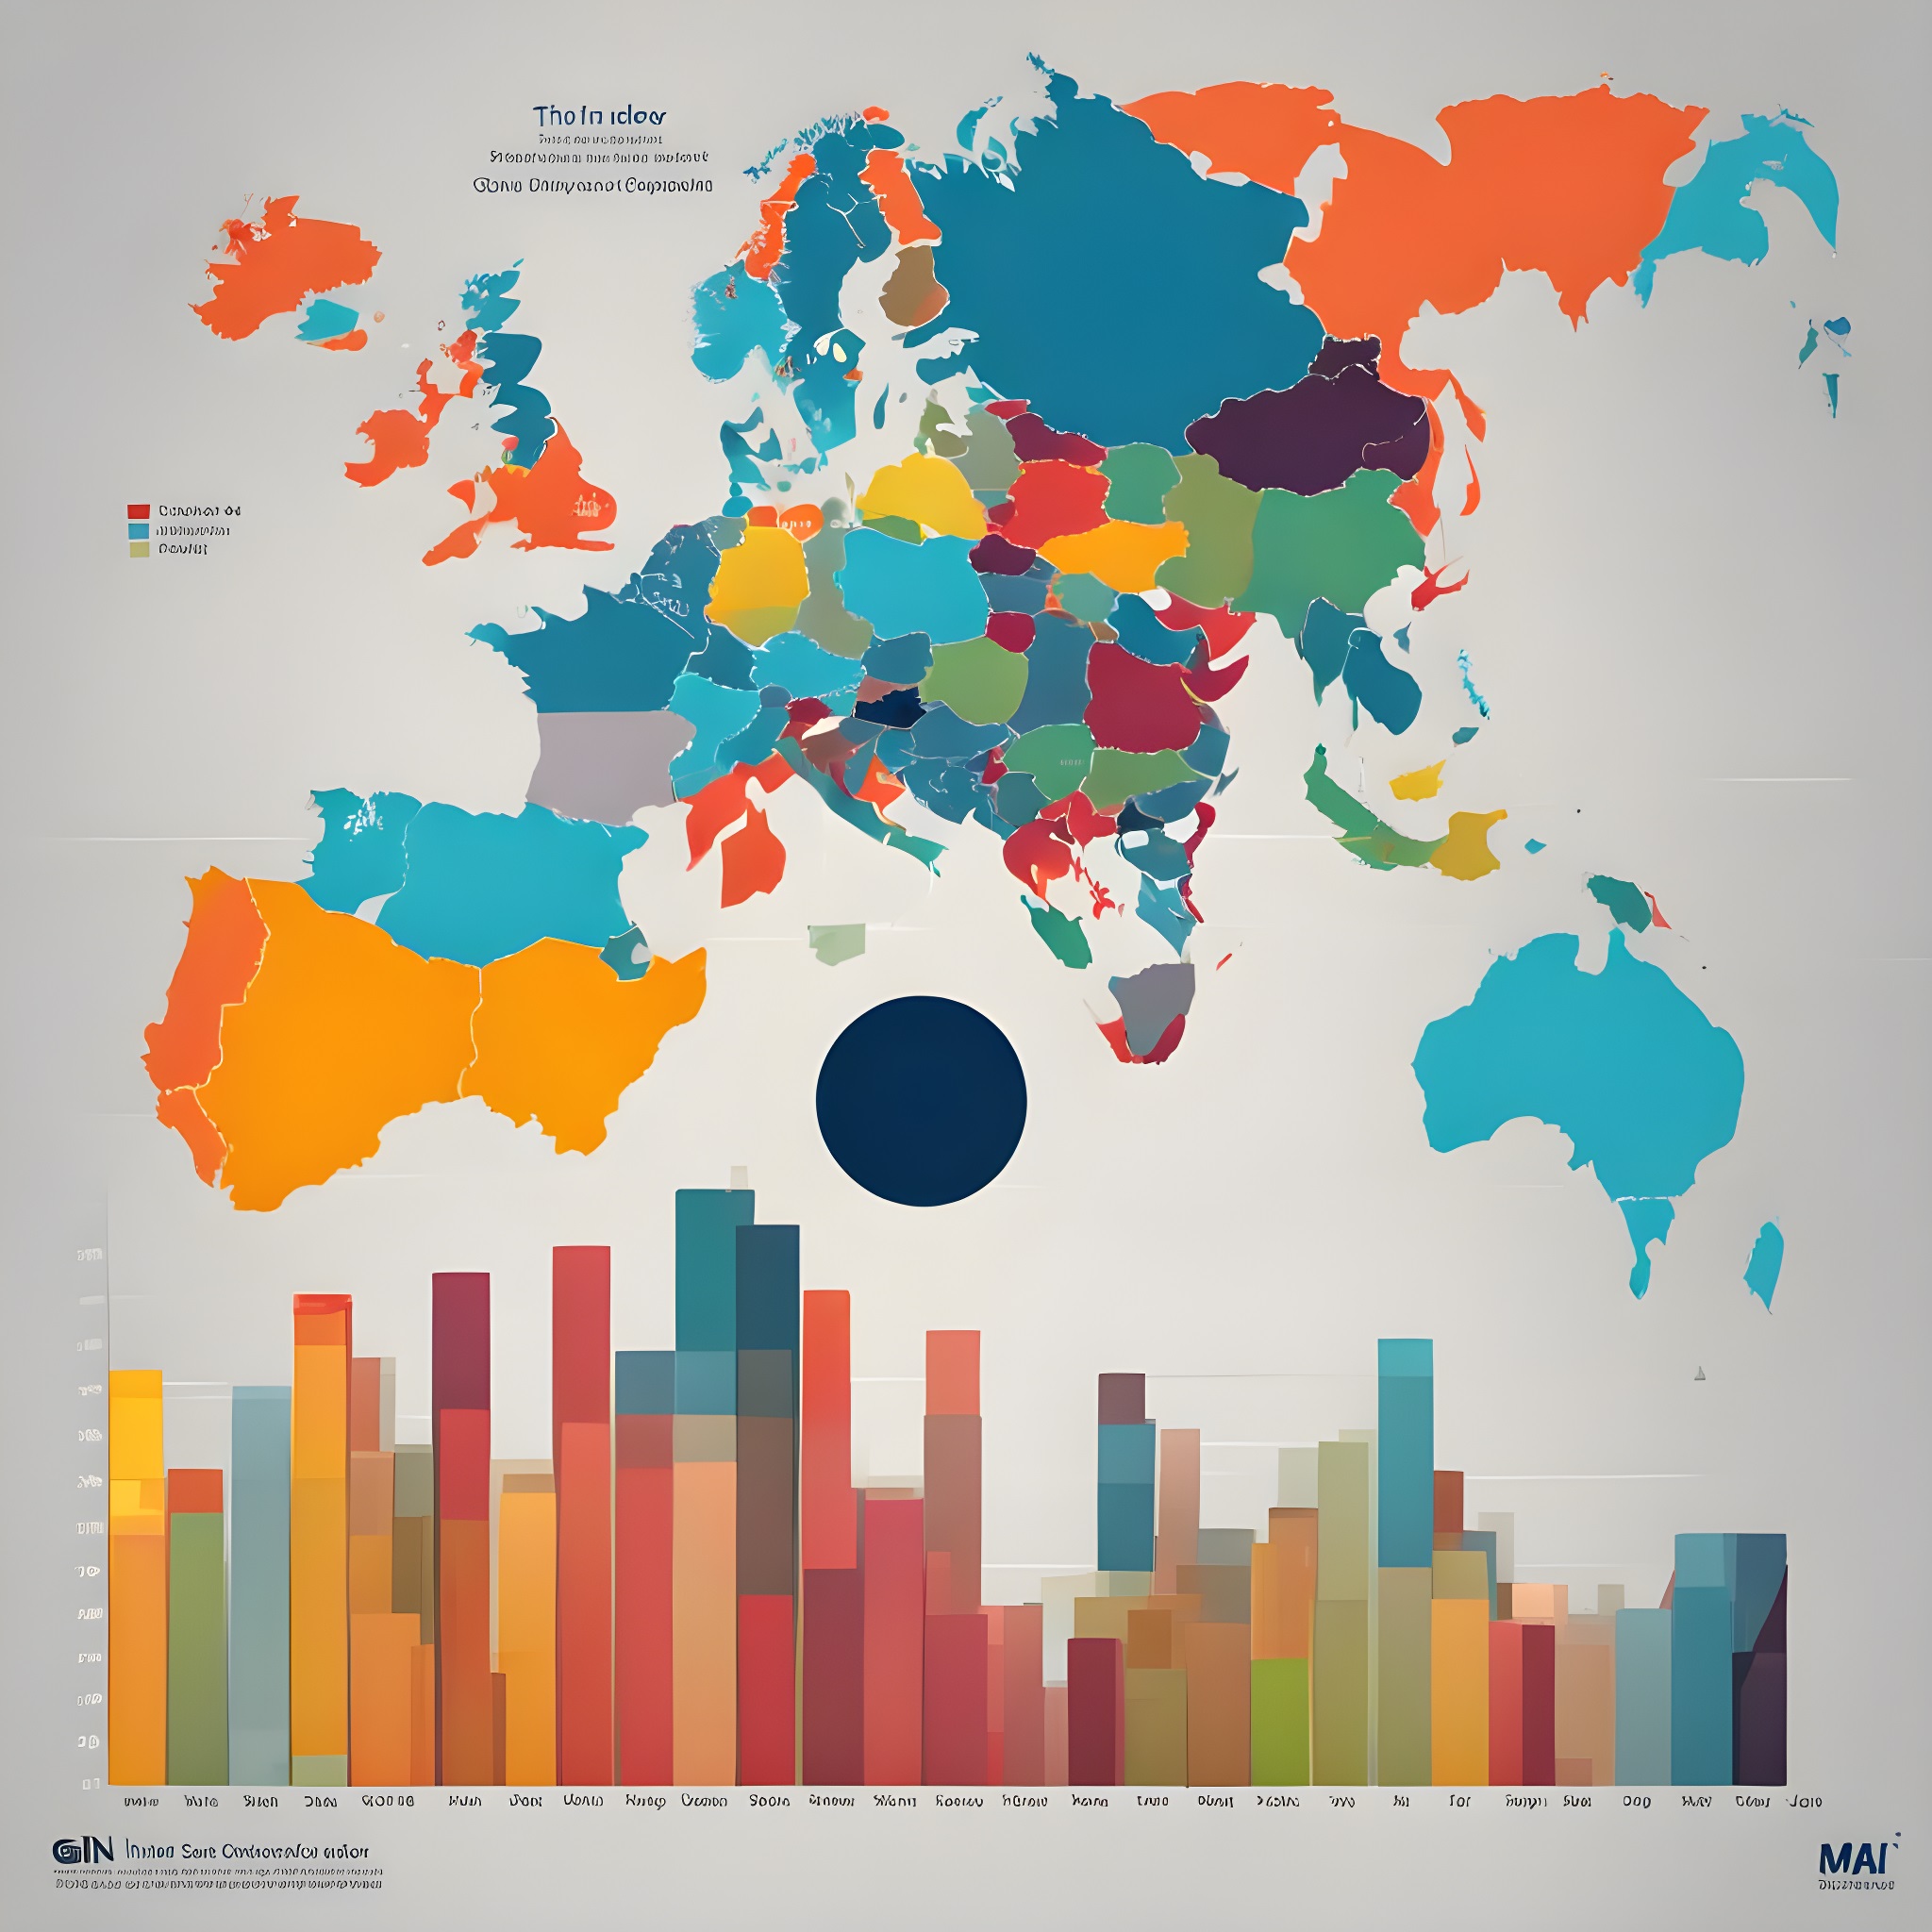
Calculation of the Gini Index
The Gini Index is typically calculated using a Lorenz curve, which is a graphical representation of income distribution. Here’s a simplified overview of the steps involved in calculating the Gini Index:
- Data Collection: Gather data on income or wealth for the population under consideration. This data can be collected through surveys, tax records, or other relevant sources.
- Sorting: Sort the data from lowest to highest income or wealth.
- Cumulative Distribution: Calculate the cumulative percentage of income or wealth held by different segments of the population. This involves adding up the percentage of income or wealth held by the lowest-income individuals, then the next segment, and so on, until you reach 100%.
- Perfect Equality Line: Draw a diagonal line representing perfect income or wealth equality, where each segment of the population holds an equal share.
- Lorenz Curve: Plot the actual income or wealth distribution on the same graph. The Lorenz curve typically lies below the perfect equality line, reflecting the unequal distribution.
- Gini Index Calculation: The Gini Index is calculated as the area between the perfect equality line and the Lorenz curve, divided by the total area under the perfect equality line. Mathematically, it can be expressed as:
G = (A / (A + B))
Where:
– G is the Gini Index.
– A is the area between the Lorenz curve and the perfect equality line.
– B is the total area under the perfect equality line.
The resulting Gini Index provides a single value that quantifies the level of income or wealth inequality. A higher Gini Index indicates greater inequality, while a lower value suggests more equitable distribution.
Significance of the Gini Index
The Gini Index is a valuable tool for policymakers, economists, and researchers for several reasons:
- Measuring Inequality: It offers a straightforward and standardized way to measure and compare income or wealth inequality across different populations and time periods.
- Policy Evaluation: Governments and organizations can use the Gini Index to assess the impact of social and economic policies. For instance, changes in taxation, welfare programs, or labor market regulations may affect income distribution.
- International Comparisons: The Gini Index allows for international comparisons of inequality, helping identify patterns and disparities among countries.
- Resource Allocation: It assists in resource allocation by highlighting areas or groups that may require targeted interventions to reduce inequality. The Complex World of Money Psychology
Historical Context
The Gini Index is named after the Italian statistician Corrado Gini, who introduced it in 1912. Gini’s work was groundbreaking at the time and laid the foundation for the systematic measurement of income inequality. Since its inception, the Gini Index has evolved, with refinements and adaptations to accommodate different types of data and factors influencing income distribution.

Criticisms and Limitations
While the Gini Index is a widely used measure of inequality, it’s not without its limitations and criticisms:
- Data Quality: The accuracy of Gini Index calculations depends on the quality and reliability of income or wealth data. Inaccurate or incomplete data can lead to misleading results.
- Sensitivity: The Gini Index can be sensitive to changes in the income distribution’s middle or upper segments, while ignoring shifts at the lower end. This means that two societies with similar Gini Index scores may still exhibit different levels of poverty.
- Scale Independence: The Gini Index does not consider the absolute level of income or wealth. Therefore, it cannot distinguish between two societies with different Gini Index scores but similar average incomes.
- Assumptions: The Gini Index assumes that inequality is unimodal, meaning that there is only one peak in the income distribution. In cases of multimodal distributions, the index may not accurately reflect the complexity of inequality patterns.
Real-World Applications
The Gini Index is used in various fields and applications:
- Economic Policy: Governments use the Gini Index to assess the impact of economic policies and design interventions to reduce inequality.
- International Development: Organizations like the United Nations and the World Bank employ the Gini Index to monitor global and regional trends in income inequality and guide development efforts.
- Business and Finance: In the business world, the Gini Index can inform market research, pricing strategies, and risk assessments.
- Social Science Research: Researchers in sociology, economics, and other social sciences use the Gini Index to investigate the causes and consequences of income inequality.
- Health and Well-being: Income inequality has implications for public health and well-being. The Gini Index is used to study these relationships.
Conclusion
The Gini Index is a powerful tool for quantifying income or wealth inequality in societies. It offers a standardized way to measure, compare, and track inequality, making it invaluable for policymakers, researchers, and organizations striving to understand and address this critical issue. However, it is essential to recognize its limitations and consider it alongside other metrics when evaluating social and economic conditions. As income inequality continues to be a global concern, the Gini Index will remain a central instrument in the quest for a fairer and more equitable world.
Related Posts


Subscribe to get the best of finance and fintech. Regularly.
Categories
Popular

- 31 May 2016 | 18112 Views

- 16 June 2020 | 15504 Views

- 19 May 2021 | 15203 Views

- 14 May 2021 | 11900 Views
Recent
